Manual and automated structural variant curation with samplot and samplot-ml
Structural variant (SV) callers, in order to maximize sensitivity, tend to suffer from high false positive rates. We have shown that it is possible to spot false positive SV calls using Samplot visualizations, but manual curation of large SV callsets can be a long and tedious process. To that end we developed Samplot-ML to discriminate between true and false positive deletion SVs.
For the better part of the past decade, convolutional neural networks (CNNs) have been used in image recognition tasks across a wide range of domains. Since Samplot was demonstrated to be an effective visualization tool for curating SV callsets, it made sense to try to train a CNN to be able to do it for us.
The workflow for Samplot-ML is simple: given a whole-genome sequenced sample (BAM or CRAM) as well as a set of putative deletions (VCF), Samplot-ML re-genotypes each putative deletion using the Samplot-generated image. The result is a call set where most false positives are flagged. For installation/usage instructions see our github github repo
Example Usage:
To demonstrate how to use Samplot-ML, let’s work through a simple example that takes us from calling SV’s to executing the Samplot-ML snakefile using some data from the 1000 genomes project (1kg).
Calling SVs with smoove
- Download a CRAM file from 1kg’s ftp
$ wget ftp://ftp.sra.ebi.ac.uk/vol1/run/ERR324/ERR3242876/HG03687.final.cram $ wget ftp://ftp.sra.ebi.ac.uk/vol1/run/ERR324/ERR3242876/HG03687.final.cram.crai - Get the reference genome
$ wget ftp://ftp.1000genomes.ebi.ac.uk/vol1/ftp/technical/reference/GRCh38_reference_genome/GRCh38_full_analysis_set_plus_decoy_hla.fa $ wget ftp://ftp.1000genomes.ebi.ac.uk/vol1/ftp/technical/reference/GRCh38_reference_genome/GRCh38_full_analysis_set_plus_decoy_hla.fa.fai - Get a set of exclude regions in bed format for use during SV calling
$ wget https://raw.githubusercontent.com/hall-lab/speedseq/master/annotations/exclude.cnvnator_100bp.GRCh38.20170403.bed - Install smoove with conda
$ conda create -c bioconda -n smoove smoove - Call SVs
$ conda activate smoove
$ smoove call -x \
 --name HG03687 \
 --exclude $exclude_bed \
 --fasta $reference \
 --genotype \
 --outdir $outdir
 $cram
The resulting vcf will be $outdir/HG003687-smoove.genotyped.vcf.gz.
-
Clone the Samplot-ML git repo
-
Next, let’s edit the config file located at
samplot-ml/workflows/samplot-ml-predict.yaml
samples:
	HG03687: "/path/to/cram" # or you can use "s3://bucket/bam_or_cram" if you've got alignments in an s3 bucket.
fasta:
	data_source: "local" # either local or s3
	file: "/path/to/reference" # or "s3://bucket/reference_file"
fai:
	data_source: "local"
	file: "/path/to/reference_index"
vcf:
	data_source: "local"
	file: "/path/to/vcf"

# generated images will have filename: ${contig}-${start}-${end}-DEL.png
# we give the choice of delimiter since contigs can sometimes contain
# character like hypens, underscores, etc.
image_filename_delimiter: "-"
outdir: "/path/to/output_directory"
- Run the prediction snakefile located at samplot-ml/workflows/samplot-ml-predict.smk
conda activate snakemake
snakemake -s samplot-ml-predict.smk \
       -j $num_threads \ # number of parallel threads to use to execute jobs
       --use-conda --conda-fronend mamba # this allows snakemake to handle dependencies
Generated images of DEL regions from the input VCF will be located at
$outdir/img/ each image will be named ${contig}-${start}-${end}-DEL.png. An
annotated vcf containing the Samplot-ML predictions will be located at
$outdir/samplot-ml-results/HG03687-samplot-ml.vcf.gz
VCF annotations
The resulting prediction vcf will contain the following format fields:
- PREF, PHET, and PALT: the prediction score assigned by the model which corresponds to a prediction of a 0/0, 0/1, or 1/1 genotype, respectively. If the region in the input vcf was originally a 0/0, then these fields will contain ‘nan’ values
- OLDGT: The original genotype of the region from the input SV callset.
- If the predicted genotype differed from the input genotype, then the model will replace the GT field with the predicted genotype.
Back to our example
Now that we’ve got our annotated VCF, let’s inspect one of the predictions and compare it with the samplot image.
# get the first DEL region from the vcf.  Print out the filename of the
# samplot image, the original genotype and the samplot-ml predicted genotype.
$ bcftools query -i 'SVTYPE="DEL"' -f '%CHROM-%POS-%INFO/END-[%SAMPLE].png\t[%OLDGT\t%GT]\n' HG03687-samplot-ml.vcf.gz | head -1
output:
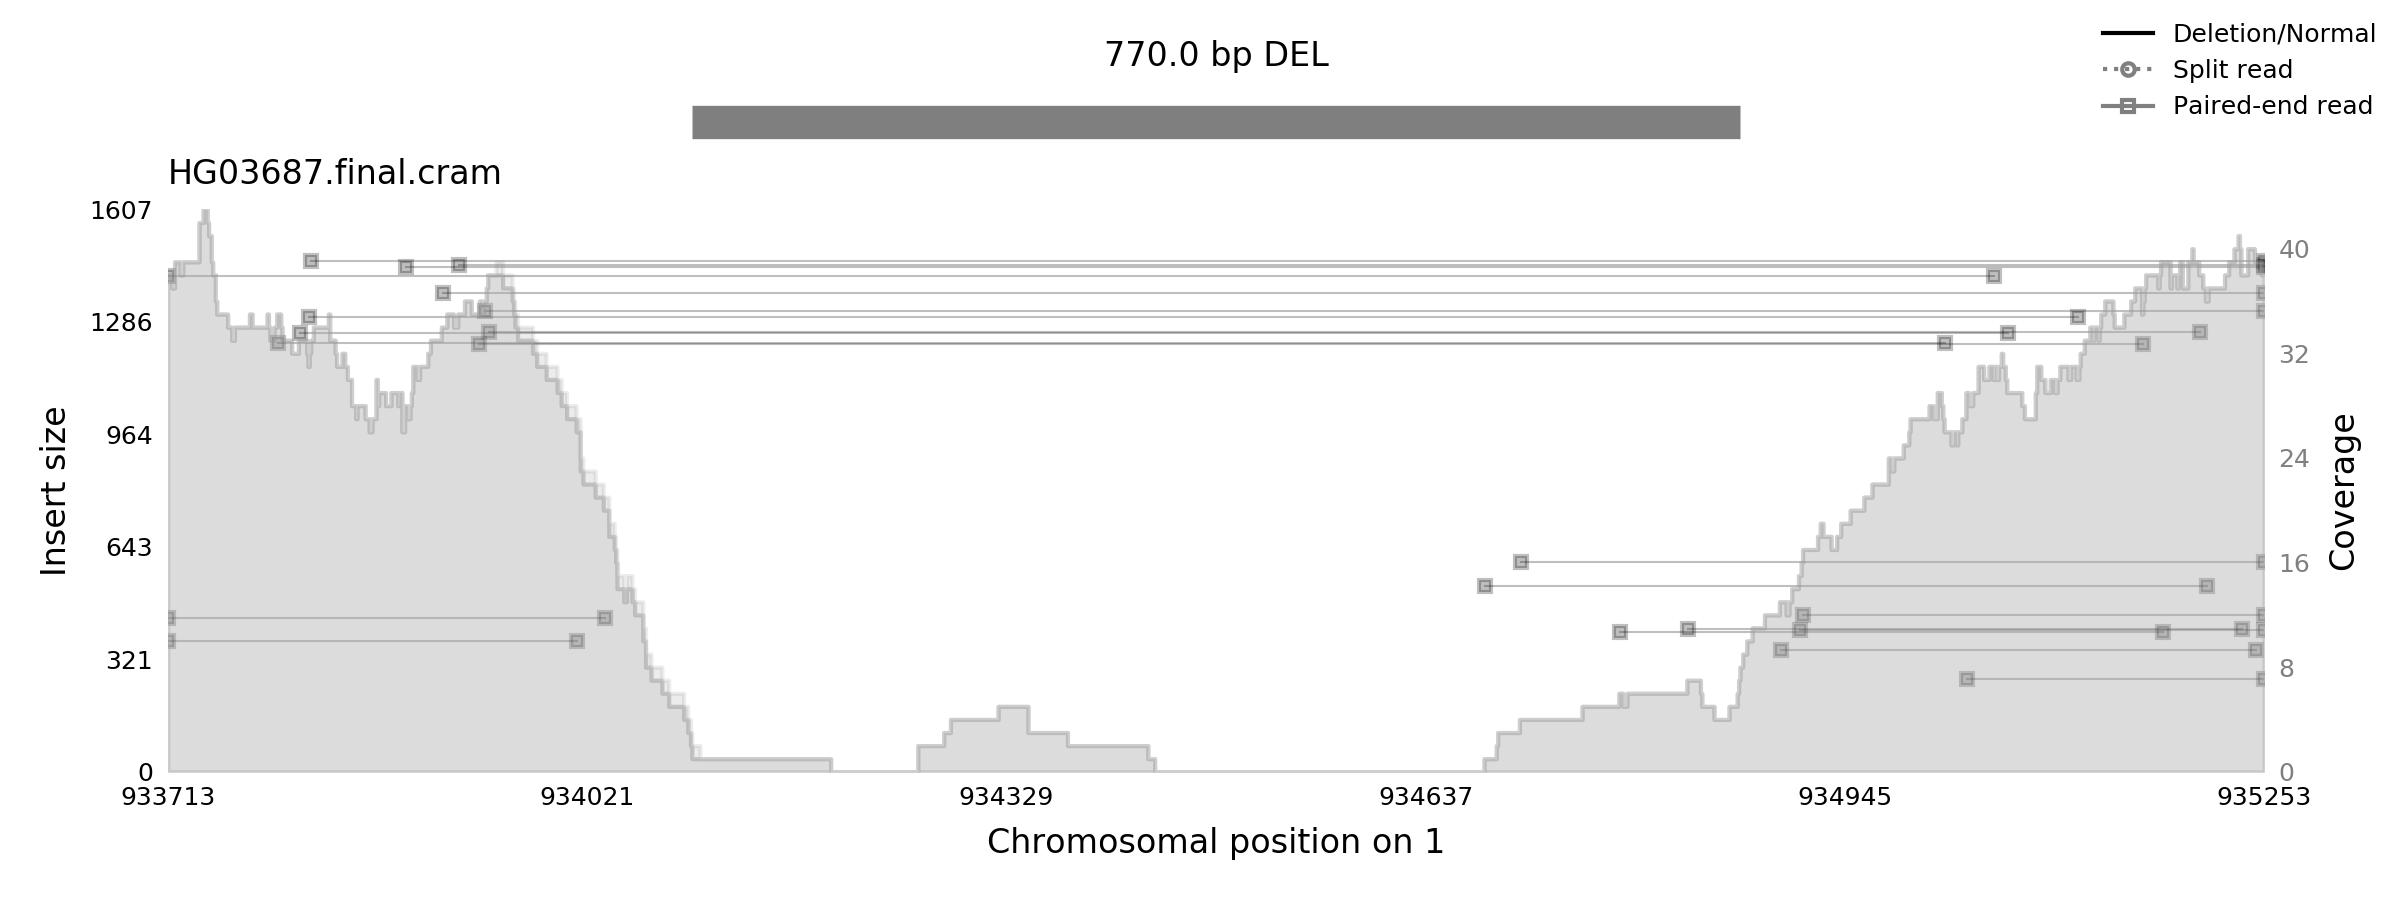
chr1-934098-934868-HG03687.png 0/1 1/1
It seems that in the very first deletion we came across, there was a difference between SVTyper’s prediction and Samplot-ML’s prediction. We went from a heterozygous deletion (0/1) to a homozygous alternate deletion (1/1). Let’s take a look at the image in question.