Monitoring Stay-at-Home Adherence for Local Governmends in the COVID-19 Pandemic
As part of the COVID-19 Mobility Data Network our lab, along with the Dan Larremore at CU and Bailey Fosdick at CSU, is using mobility data from Facebook Data for Good to help state and local governments monitor activey in their jurisdicitons while stay-at-home orders are in place and as reopening begins.
We are currently working directly with:
- Boulder County, CO
- Arapahoe County, CO
- Denver, CO
- Salt Lake County, UT
- University of Colorado, Boulder
Facebook provides aggregaed an annonmized user density data three times per day for tiles that range in size from 2km to 0.6km squater.
From this data we have developed metrics that measure activity trends. Some of our metrics include:
- A weekend score measures the differences between weekday and weekend activity. Ideally, if people are staying home and not working, there should not be a difference.
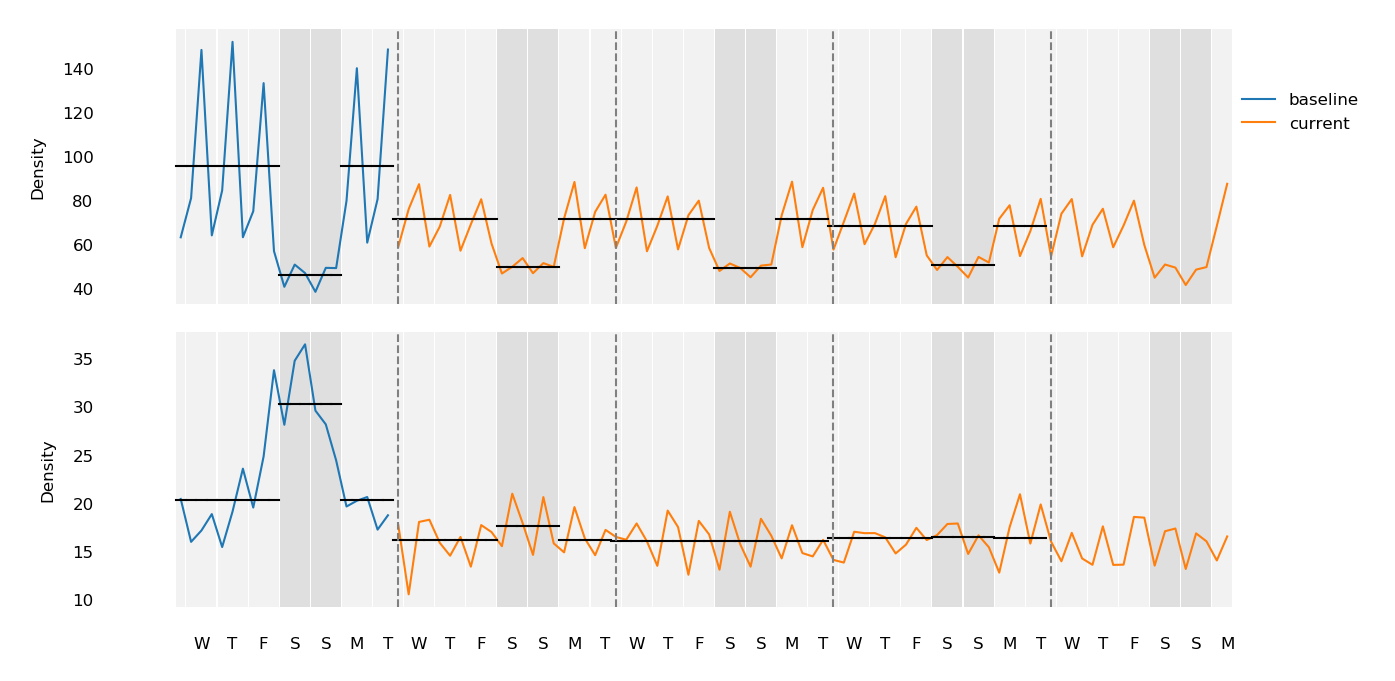
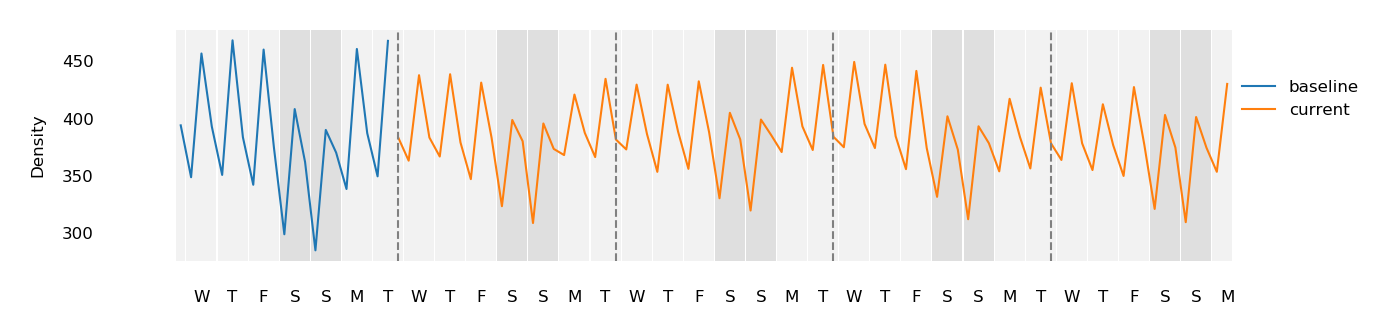
- A slip score, which measures the difference in activity between adjacent weeks. This score should be near zero during a stay-at-home order.

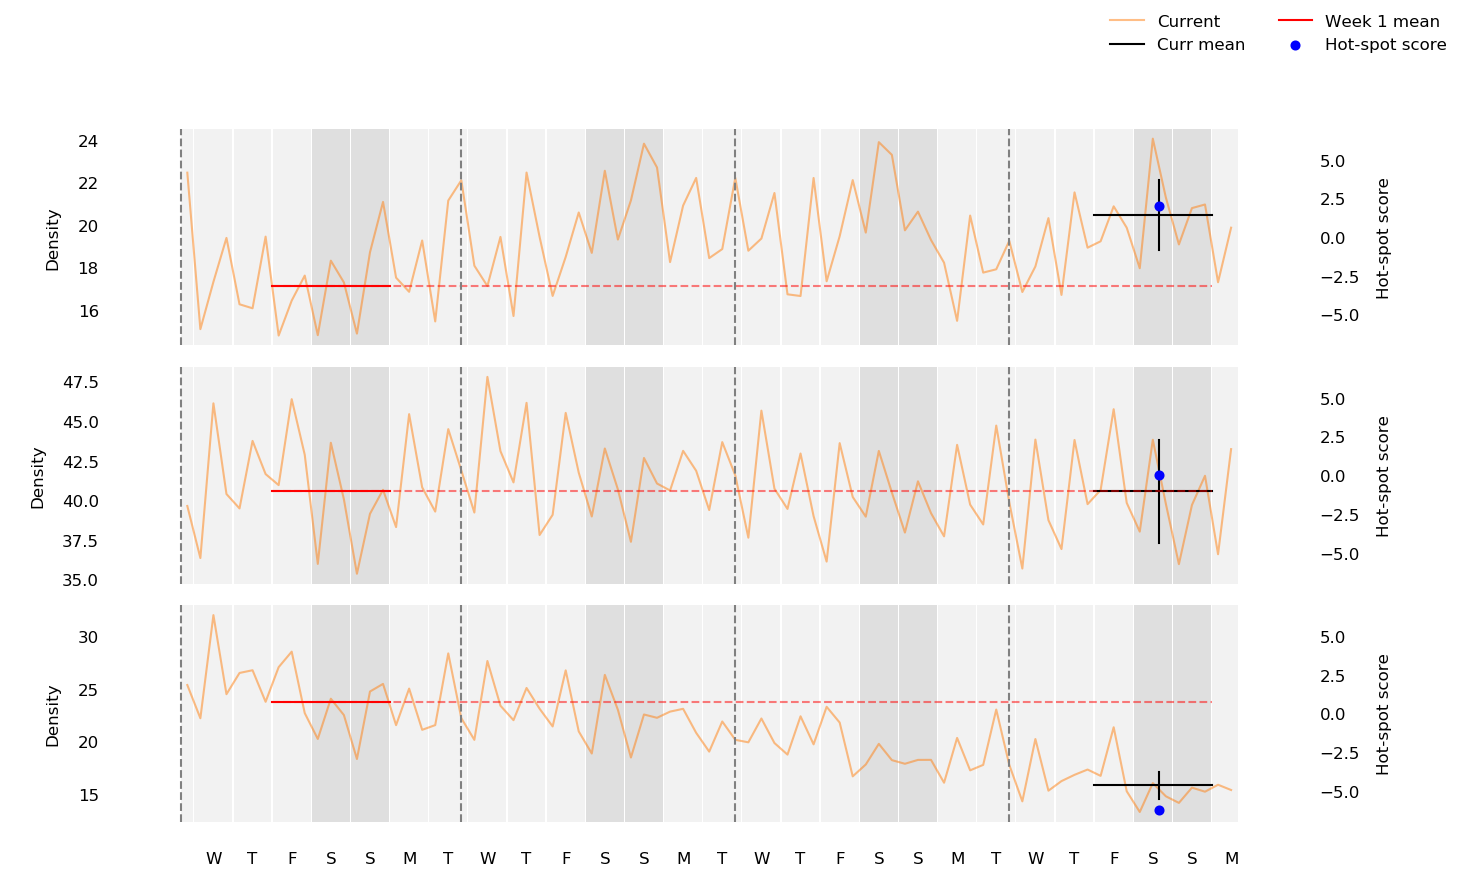
- A hot-spot score, which measures the difference between current activity and activity during the first week of the stay-at-home order.
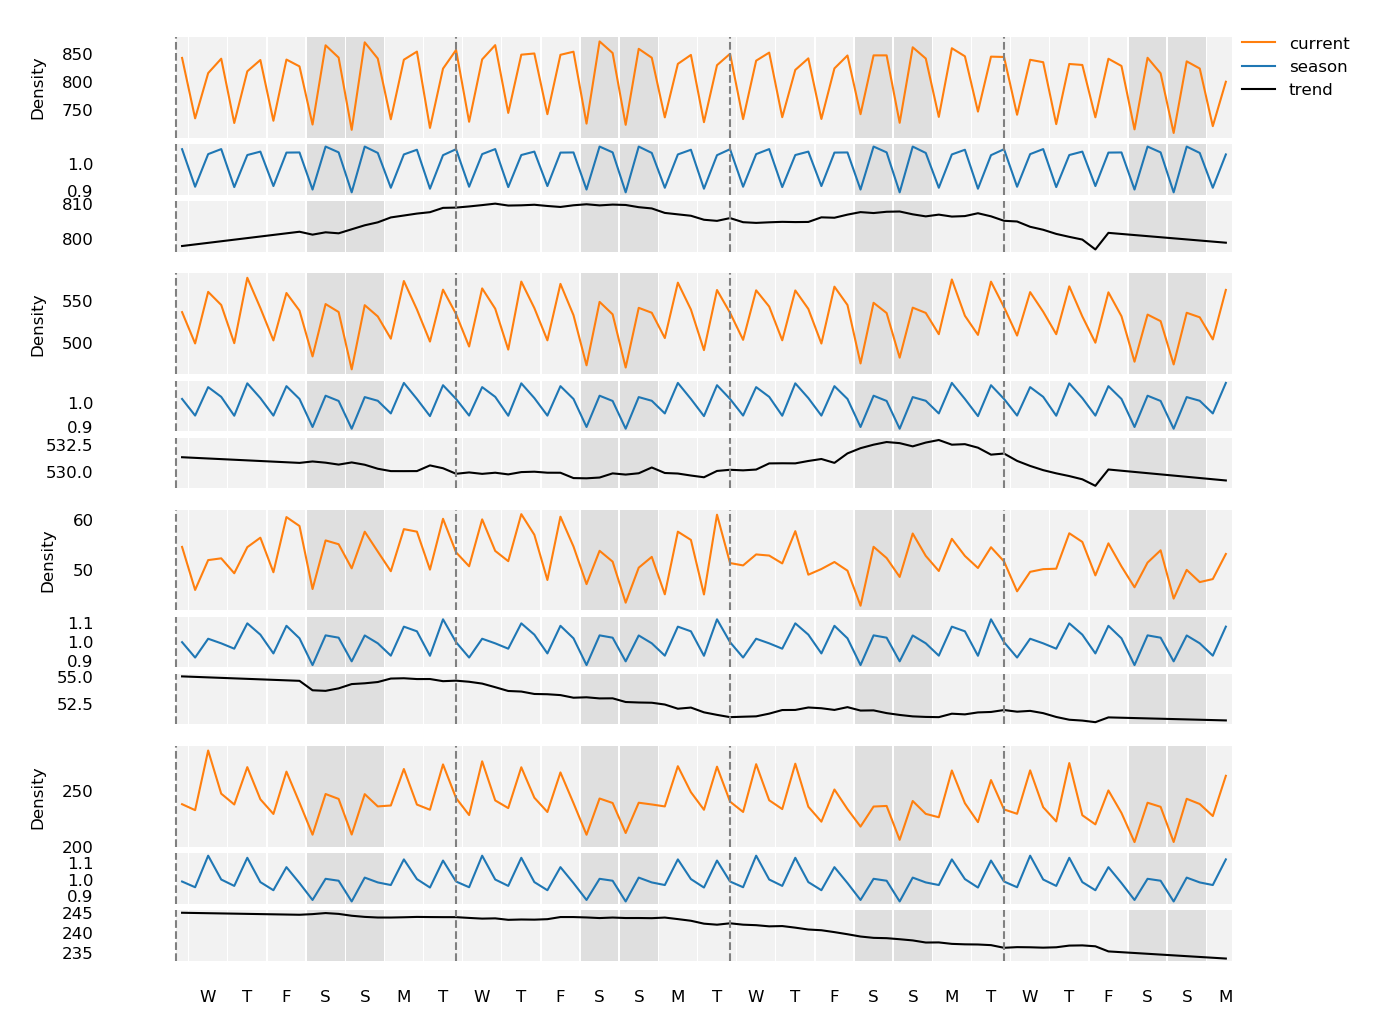
We are also using models to decompose the data into seasonal (night/day, weekday/weekend) and trend values.
To help explore these data, we are developing an interactive browser using plotly dash. Here is a quick demo of our data browser:
Full details can be found at our github repo.