Samplot Improvements: Split View / SV Browser
We have made two major updates to Samplot
1. Split view
The original version of samplot visualized one continuous genomic region, which made viewing translocations impossible and large SVs difficult and time-consuming. By providing support for two areas, we can now plot the two ends of a translocation and zoom into the breakpoints of large SVs.
Here is the chromosome 2/X inverted translocation that we identified in a patient with early infantile epileptic encephalopathy (EIEE) [BE Ostrander et al., Genomic Medicine 2018]. Notice the break in the middle that is indicated by an ellipsis in the SV plot on top and whitespace in the sample plot. Split view support has also been extended to annotation and transcript plots, as seen below.
This plot is generated by providing 2 sets of chromosomal positions and using
the --zoom parameter to specify the size of the flanking regions.
python samplot.py \
    -c 2 -s 59405943 -e 59405943 \
    -c X -s 151118533 -e 151118533 \
    -b samplot/test/data/2_59305747-59505747_X_151018513-151218513.BND.bam
    -o translocation.png \
    -t BND \
    --zoom 10000
Here are the original and zoomed plots for a 45Kb deletion in HG002 sample from the GIAB Ashkenazim Trio. The full plot took four seconds to complete and the zoom took one second.
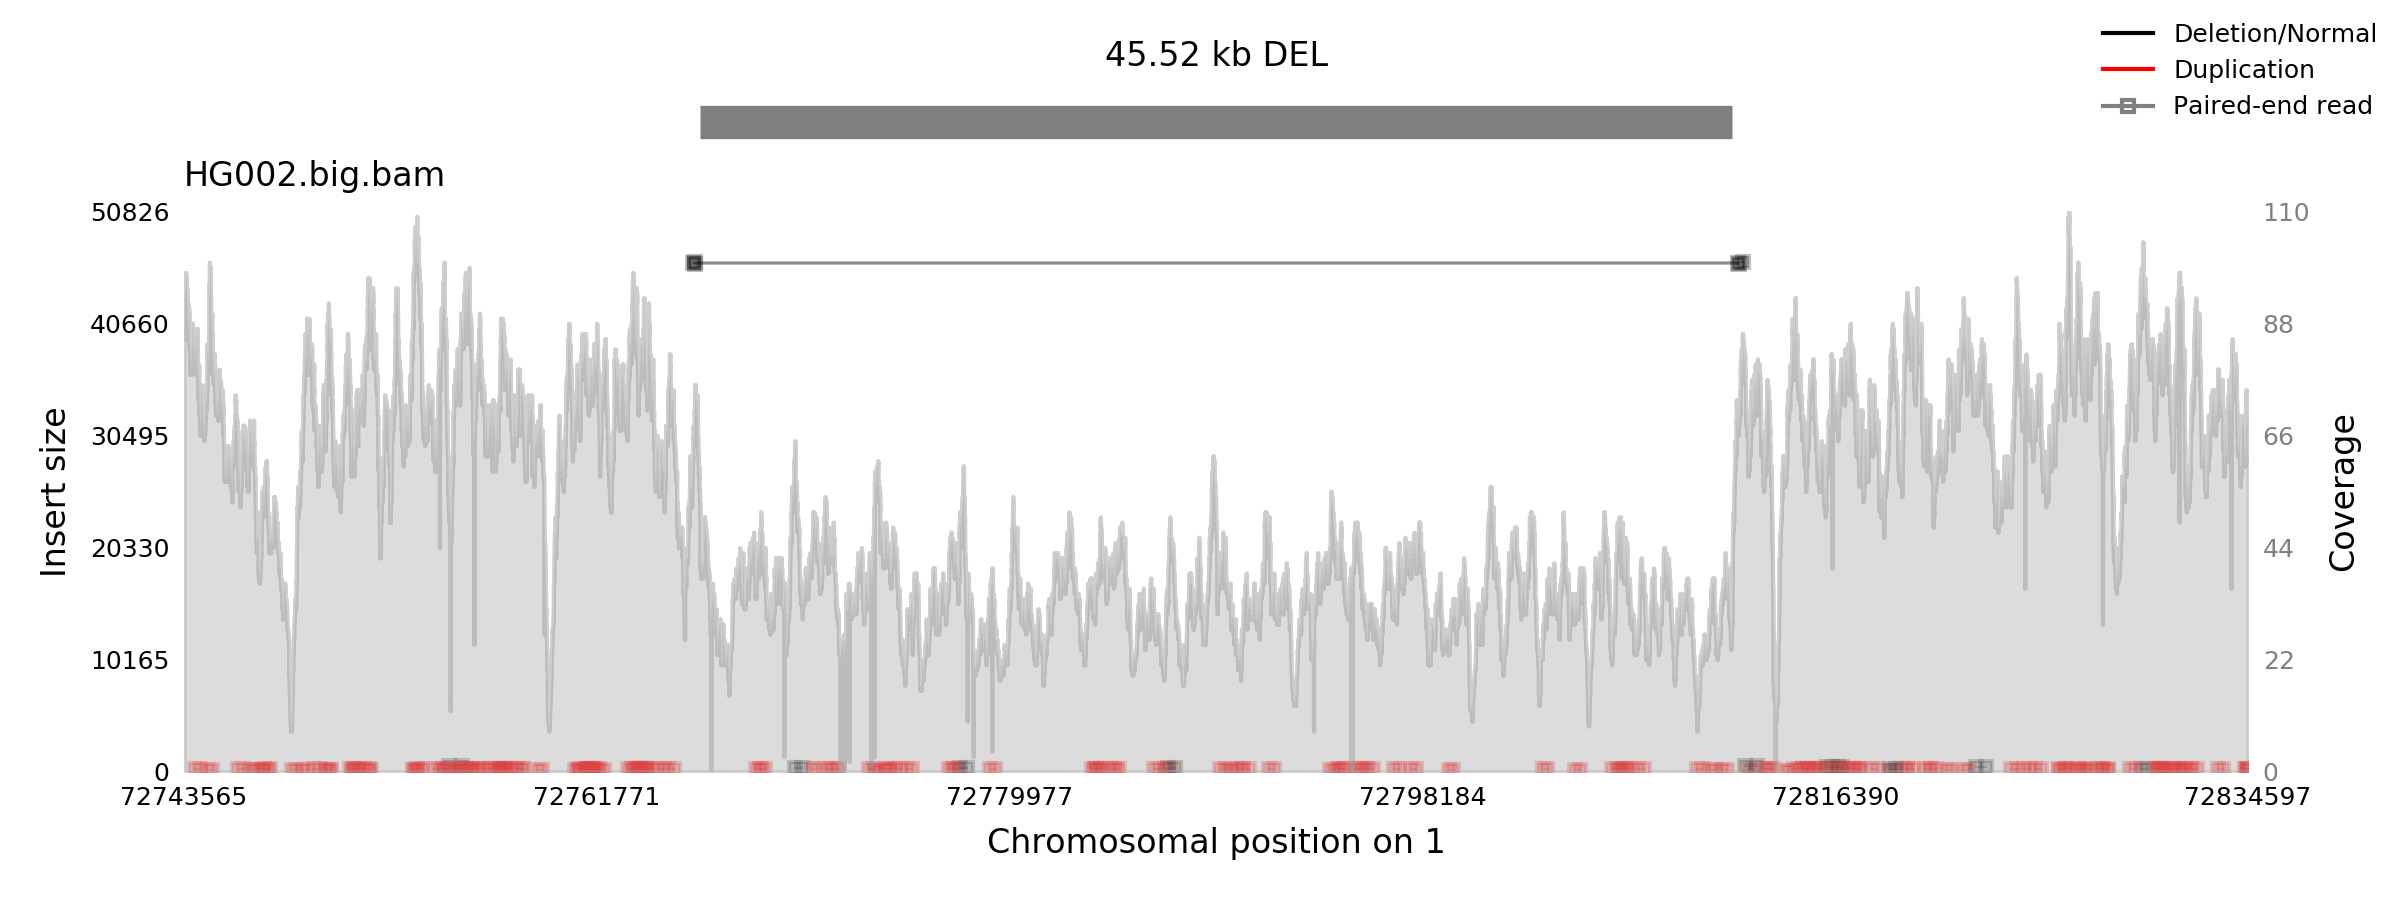
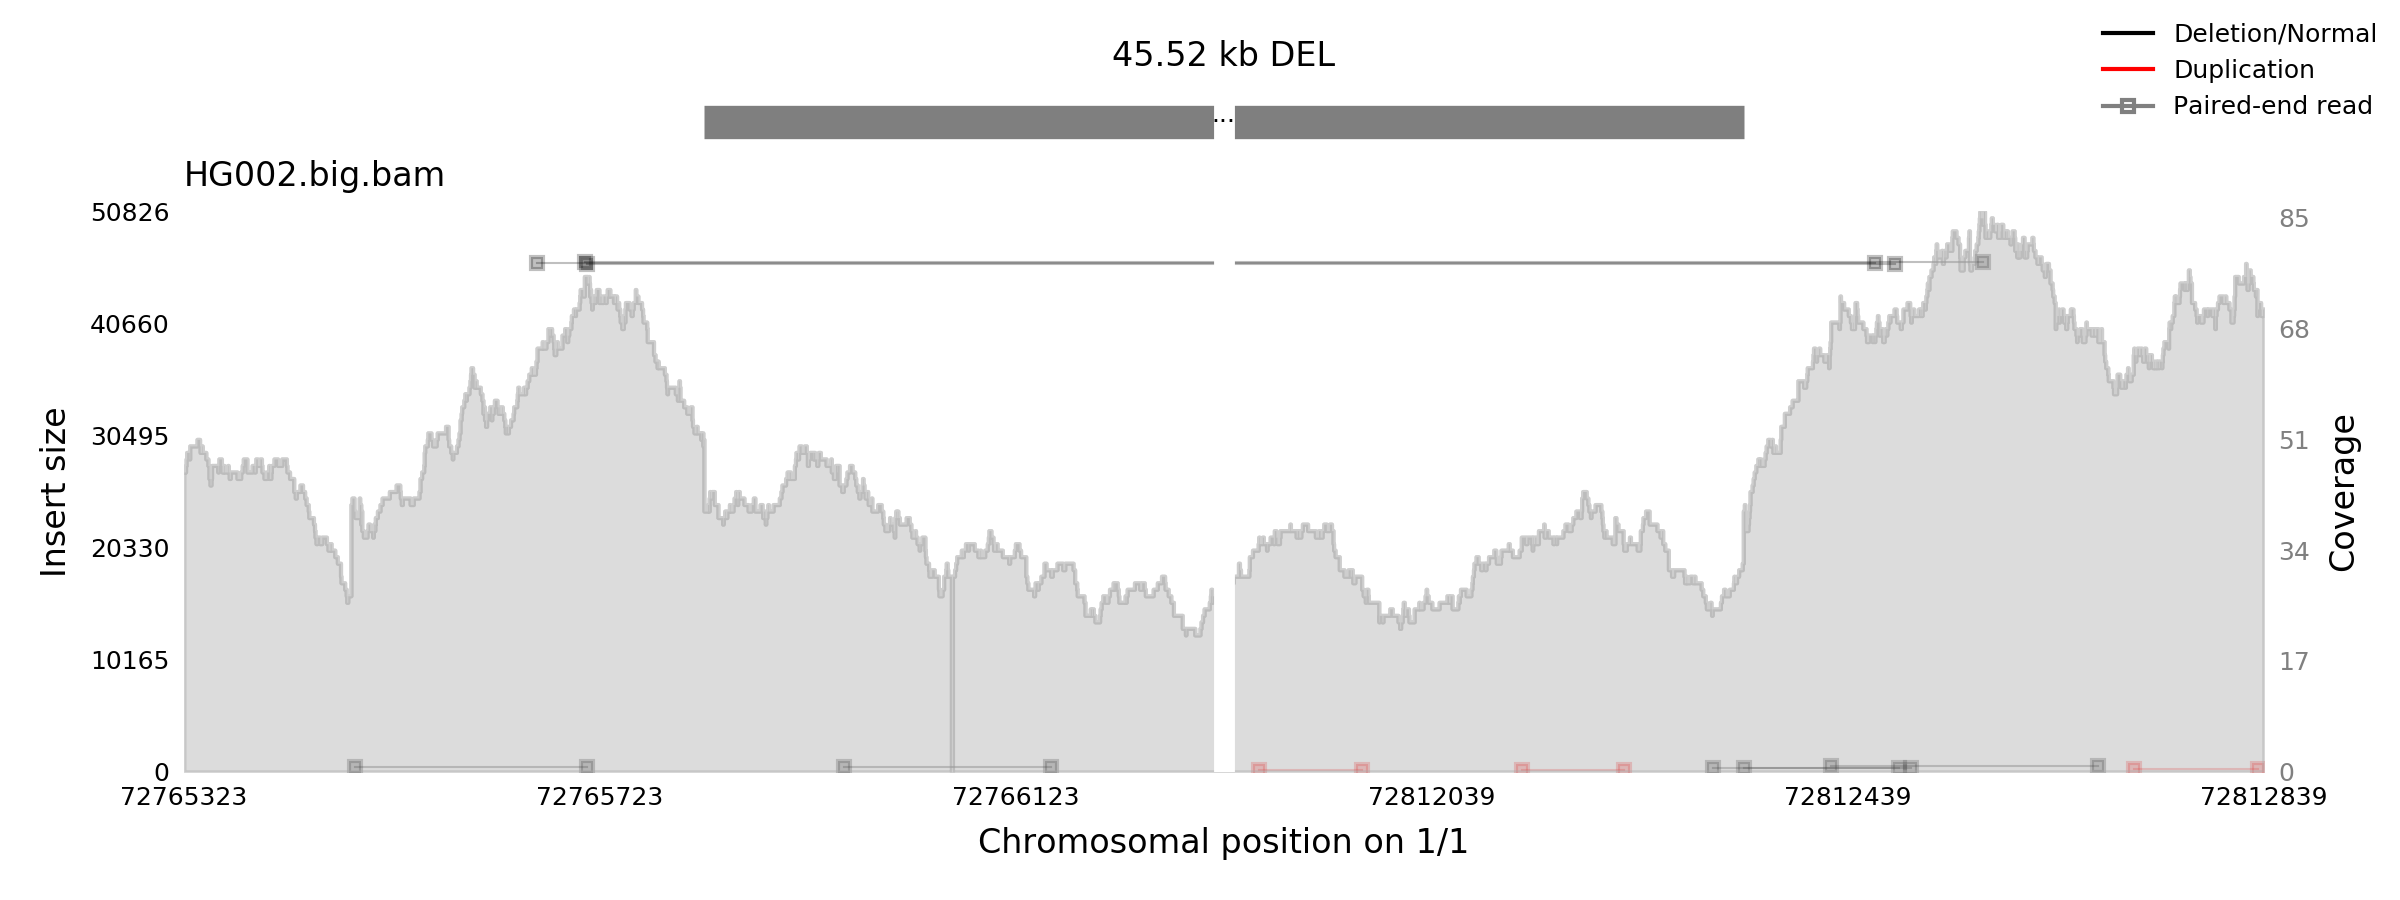
Generating a zoomed plot is straightforward, add the --zoom parameter:
python samplot.py \
    -c 1 -s 72766323 -e 72811839 \
    -b HG002.hs37d5.2x250.bam \
    -o big_zoom.png \
    -t DEL \
    -d 10 \
    --zoom 1000
2. SV VCF browser
Given a VCF with SVs and the sample BAMs, run samplot_vcf.py to generate the
variants plots and a web page that provides an interface to browse the plots.
For example, the SVs in samplot/test/data/test.vcf produce the following
site. Basic information about the SVs is given in each row, and an SV plot can
be displayed below by clicking on the row.
We have many improvemtns planned for this interface, so stay tuned.
The command to produce this site is:
    python ../../src/samplot_vcf.py \
        -d output_dir \
        --vcf test.vcf \
        --sample_ids HG002 HG003 HG004 \
        -b ../data/HG002_Illumina.bam \
        ../data/HG003_Illumina.bam \
        ../data/HG004_Illumina.bam \
        --command_file samplot_commands.sh
This command will create the directory output_dir, output_dir/index.html,
and samplot_commands.sh which contains the commands needed to generate the
samplot images. Run bash samplot_commands.sh and the plots will be placed
into output_dir, and begin browsing.
See the samplot page for the full documentation.