Samplot: Rapid SV Visualization
Visualization is an integral part of SV discovery and validation, and many methods have been developed to help make this less painful.
Personally, I use IGV because it allows me to dig into individual SVs. You can load multiple samples and multiple annotation tracks, inspect single reads, and zoom in/out and look up/downstream of the event. These features can help us to understand why a particular call was made/missed. Unfortunately IGV, and really any piece of software, has some functionality gaps. IGV requires a lot of clicking, menu selecting, zooming in and out, and scanning. Consider the case given below where I want to look at a particular SV in three samples.
It is a little bit of a pain.
This gets even worse if I want to look at MANY SVs. That is a lot more
clicking, re-sorting, and scanning. To make matters worse, what if the BAMs are
not on my local machine or even a local server? Whate if the BAMs are in the
cloud or on a collaborator’s cluster where ssh -X is just not going to cut it.
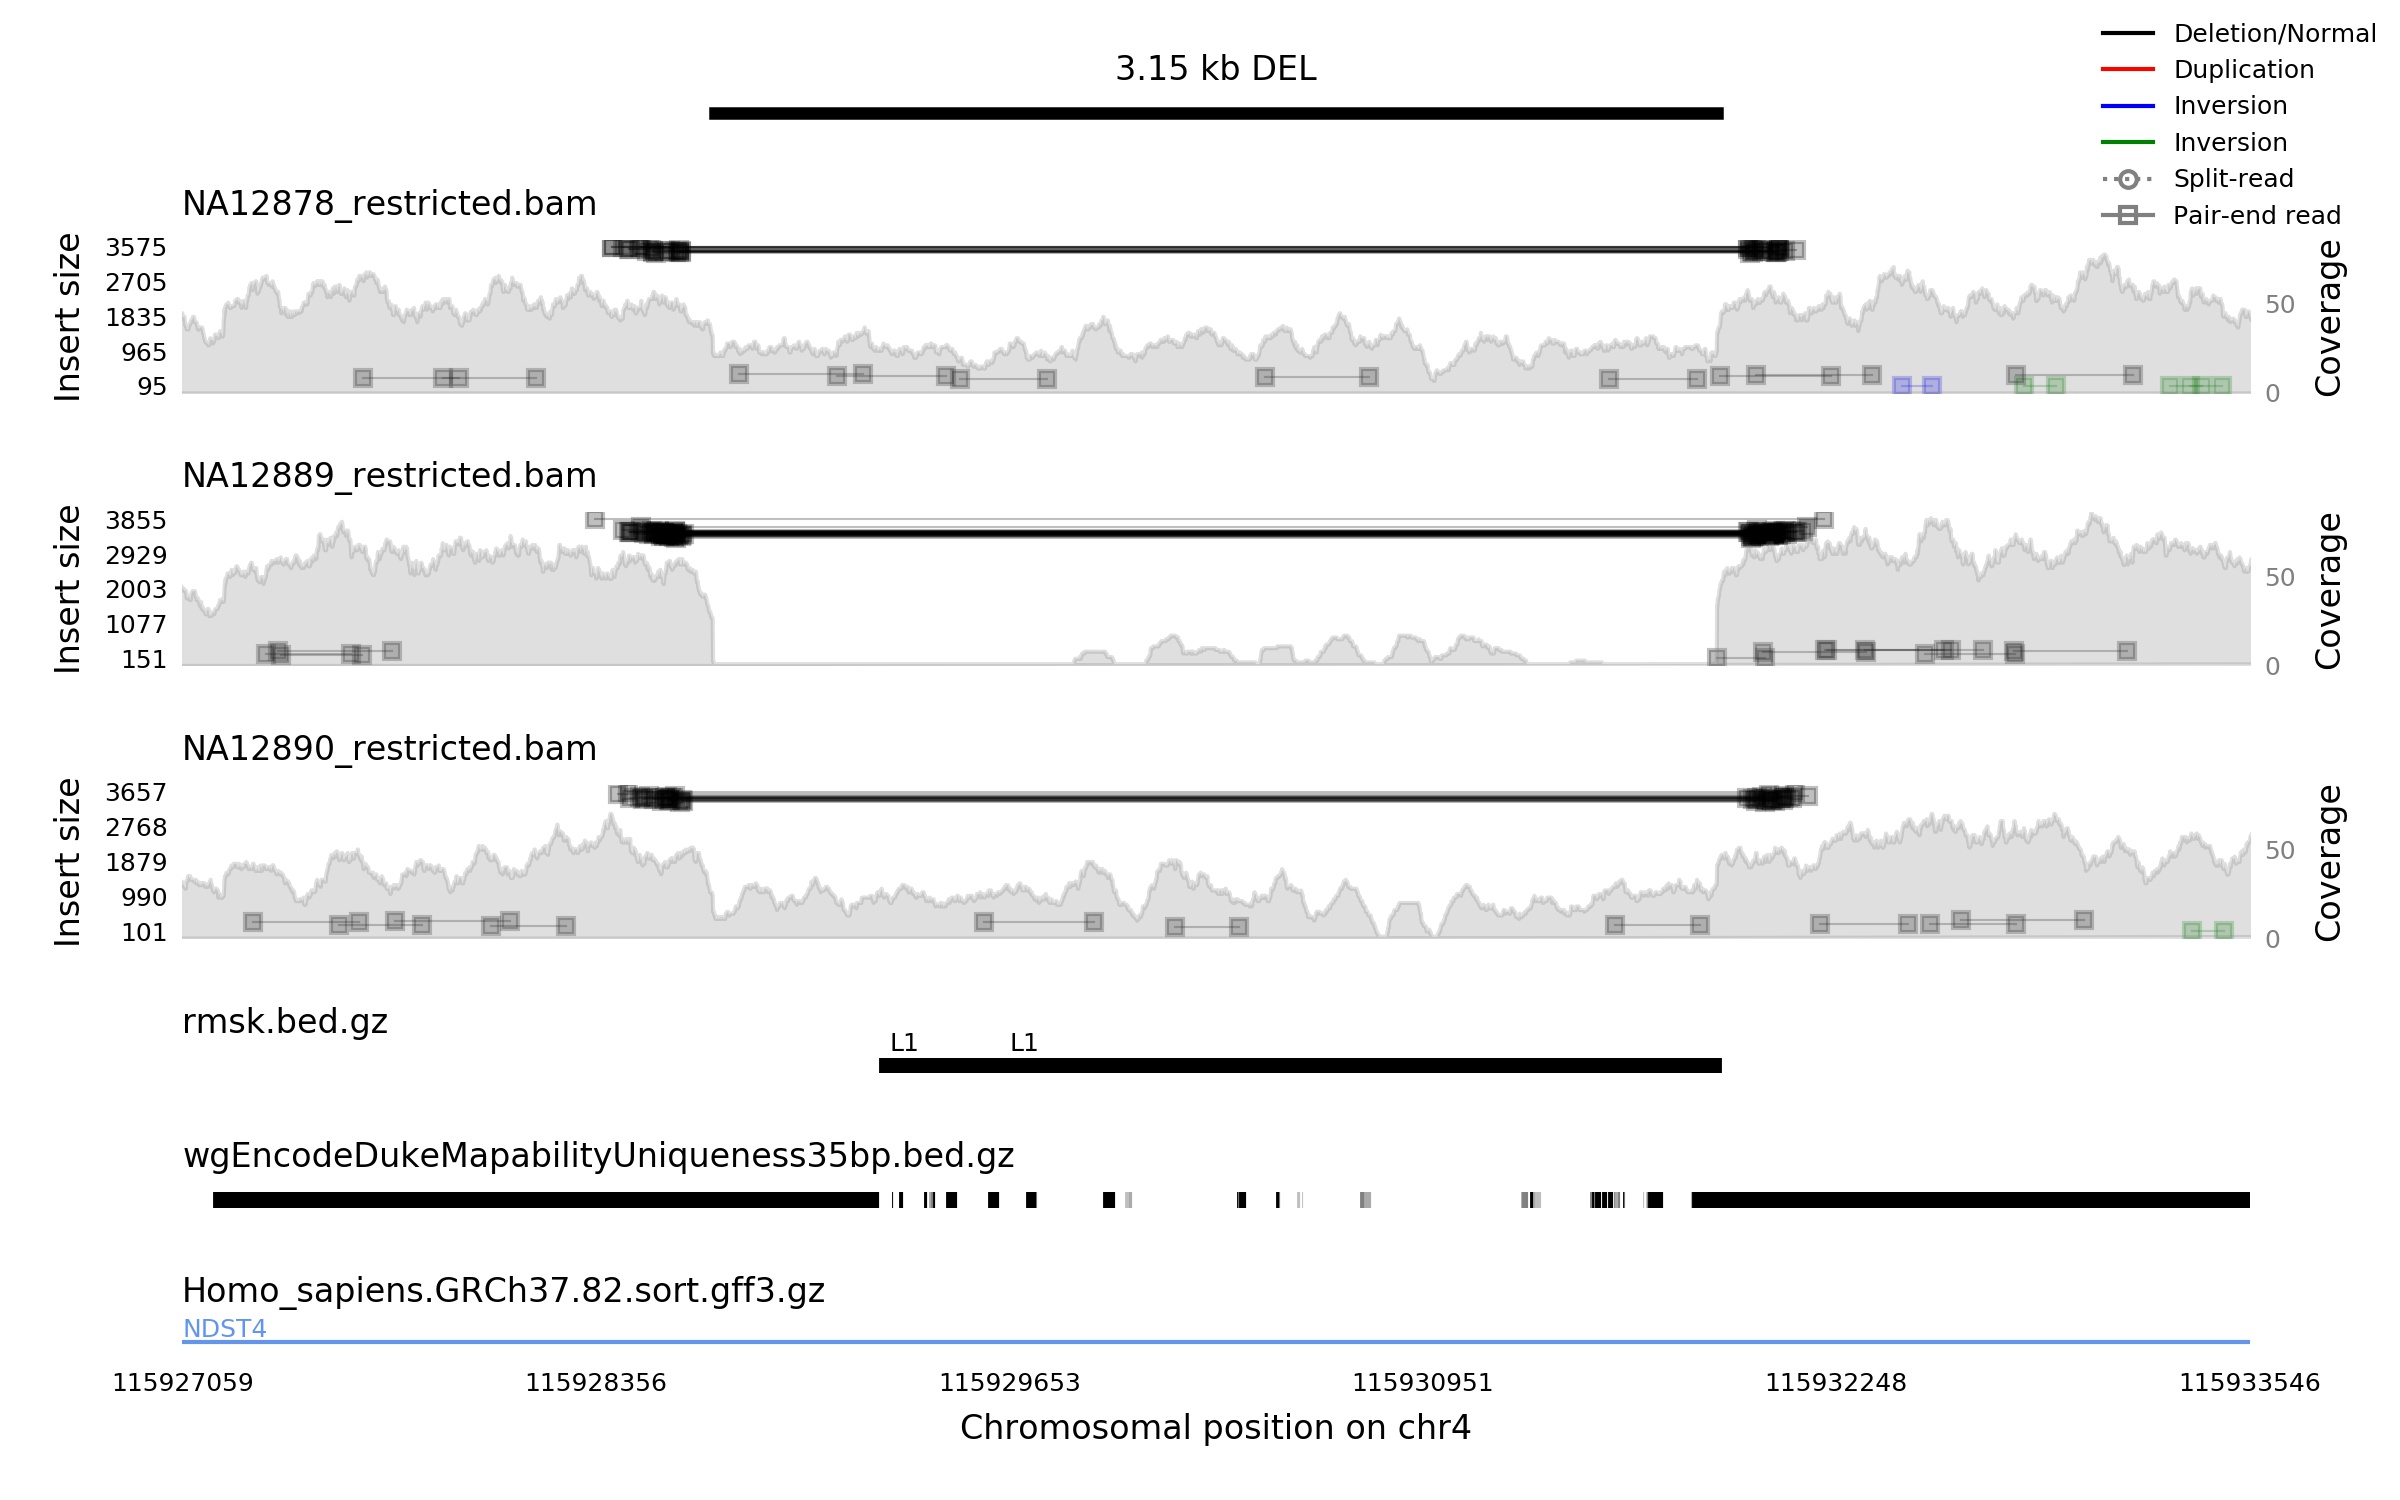
To address this case we developed samplot. A command line tool that takes SV coordinates and bam files and produces high-quality images that highlight any alignment and depth signals that substantiate the SV. Here is that same SV for the same samples from samplot.
To get this image you need to: Get the code:
git clone https://github.com/ryanlayer/samplot.git
Get the annotations:
wget ftp://ftp.ensembl.org/pub/grch37/release-84/gff3/homo_sapiens/Homo_sapiens.GRCh37.82.gff3.gz
bedtools sort -i Homo_sapiens.GRCh37.82.gff3.gz \
| bgzip -c > Homo_sapiens.GRCh37.82.sort.gff3.gz
tabix Homo_sapiens.GRCh37.82.sort.gff3.gz

wget http://hgdownload.cse.ucsc.edu/goldenpath/hg19/encodeDCC/wgEncodeMapability/wgEncodeDukeMapabilityUniqueness35bp.bigWig
bigWigToBedGraph wgEncodeDukeMapabilityUniqueness35bp.bigWig wgEncodeDukeMapabilityUniqueness35bp.bed
bgzip wgEncodeDukeMapabilityUniqueness35bp.bed
tabix wgEncodeDukeMapabilityUniqueness35bp.bed.gz

curl http://hgdownload.soe.ucsc.edu/goldenPath/hg19/database/simpleRepeat.txt.gz \
| bgzip -d -c \
| cut -f2,3,4 \
| bedtools sort -i stdin \
| bgzip -c \
> simpleRepeat.bed.gz
tabix simpleRepeat.bed.gz

curl http://hgdownload.soe.ucsc.edu/goldenPath/hg19/database/rmsk.txt.gz \
| bgzip -d -c \
| cut -f 6,7,8,13 \
| bedtools sort -i stdin \
| bgzip -c > rmsk.bed.gz
Make the image:
samplot/src/samplot.py \
    -c chr4 \
    -s 115928730 \
    -e 115931875 \
    -b samplot/test/data/NA12878_restricted.bam,samplot/test/data/NA12889_restricted.bam,samplot/test/data/NA12890_restricted.bam \
    -o samples.jgp \
    -t DEL \
    -d 10 \
    -T Homo_sapiens.GRCh37.82.sort.gff3.gz \
    -A rmsk.bed.gz,wgEncodeDukeMapabilityUniqueness35bp.bed.gz
Each sample gives the per-base coverage (filled grey area) scaled on the right y-axis and the alignments scaled by insert size (distance between pair ends) on the left y-axis. Paired-end alignments are boxes connected by solid lines. Split-read alignments are circles connected by dashed lines. The color of the alignments correspond to the type of SV they appear to support.
Since most BAMs are mostly normal reads, we can reduce runtime and plot messiness by giving users the option to display only a small sample of the concordant reads (+/- orientation and a normal insert size). Here we see just 10 “normal reads.”
Under the samples are a variable number of annotations (bgziped, tabixed BED files) whose behavior is driven by the 4th column of the file. If it is empty, then the intervals are displayed as black bars. If the 4th column is a float, then that float drives the grayscale color of the bar where one is dark zero is white (e.g., wgEncodeDukeMapabilityUniqueness35bp.bed.gz. If the 4th column is present but is not a float, it is treated as a name and displayed above the interval (e.g., rmsk.bed.gz annotation). Last is a transcript file that gives genes and exons. This region spans an intronic region of the NDST4 gene.
While static images lack some of the functionality that interactive browsers provide, there are quite a few upsides. If the BAMs are remote, then run samplot on the remote server and download the image files. If you have many SVs, you can fire off many samplot runs (in parallel with something like gargs). If you are overwhelmed by going through all of those images, or if you have a team that wants to collaborate on reviewing the SVS, then check out SV-plaudit ( source code, setup video, preprint )