GIGGLE is out!
First the links:
GIGGLE is a genomics search engine that identifies and ranks the significance of shared genomic loci between query features and thousands of genome interval files. If you, for example, were interested in understanding the genetics of Rheumatoid Arthritis, then you could use the genome wide-significant SNPs from a GWAS to search a database of Roadmap Epigenomics (specifically the tissue/CHROMHMM predicted state annotations).
Here are the results visualized in a heat map where the short axis give the CHROHMM states, and the long axis gives the tissues. The color of each cell corresponds to the GIGGLE score of the query (Rheumatoid Arthritis SNPs) and a database file (tissue/genomic state, e.g., heart muscle enhancer). Darker red means a more positive relationship and darker blue means more negative relationship.
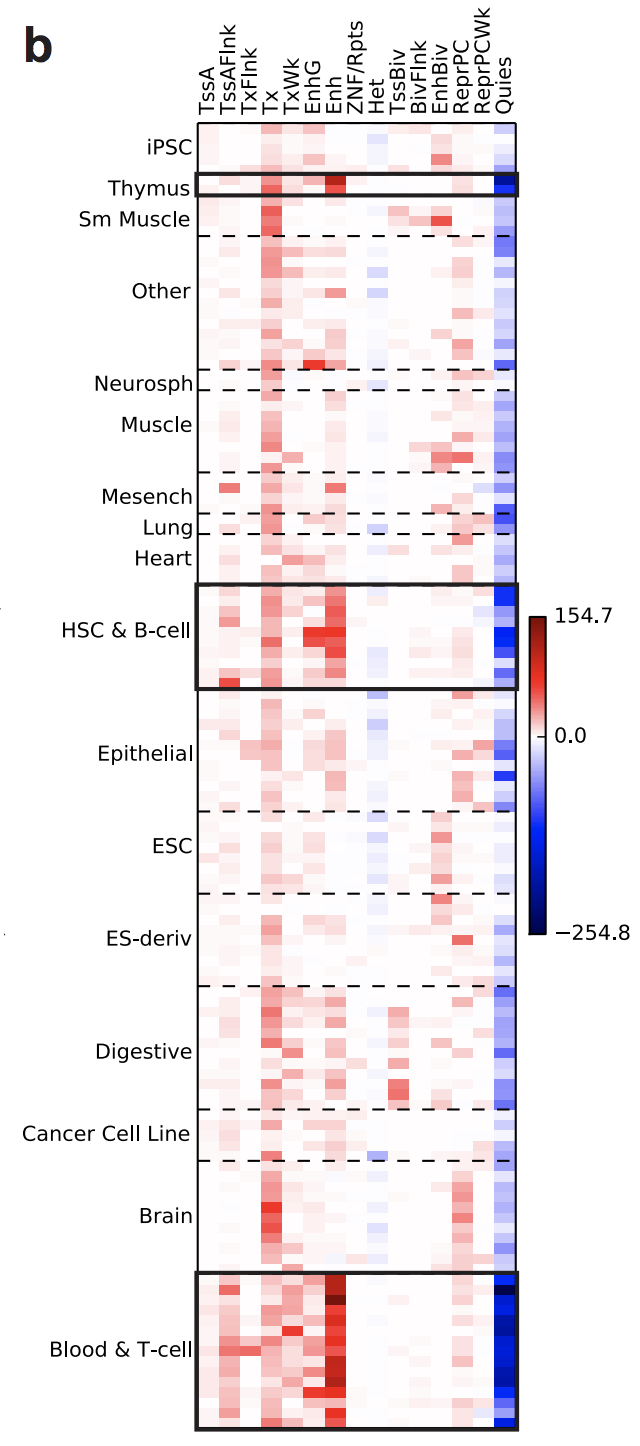
(From Fig2b)
As you can see, the SNPs cluster in T-cells, B-cells, and the Thymus, which is a signature of an autoimmune disorder. While we know that Rheumatoid Arthritis is an autoimmune disorder, we did not always know this. You can imagine how insightful this type of search would be for new diseases or ones where the role of the immune system is underappreciated.
The steps for recreating this results are HERE.
Under the hood, GIGGLE is a B+Tree that was inspired by the Time Index
An example of a GIGGLE index of 3 annotation files (A, B, and C) is here:
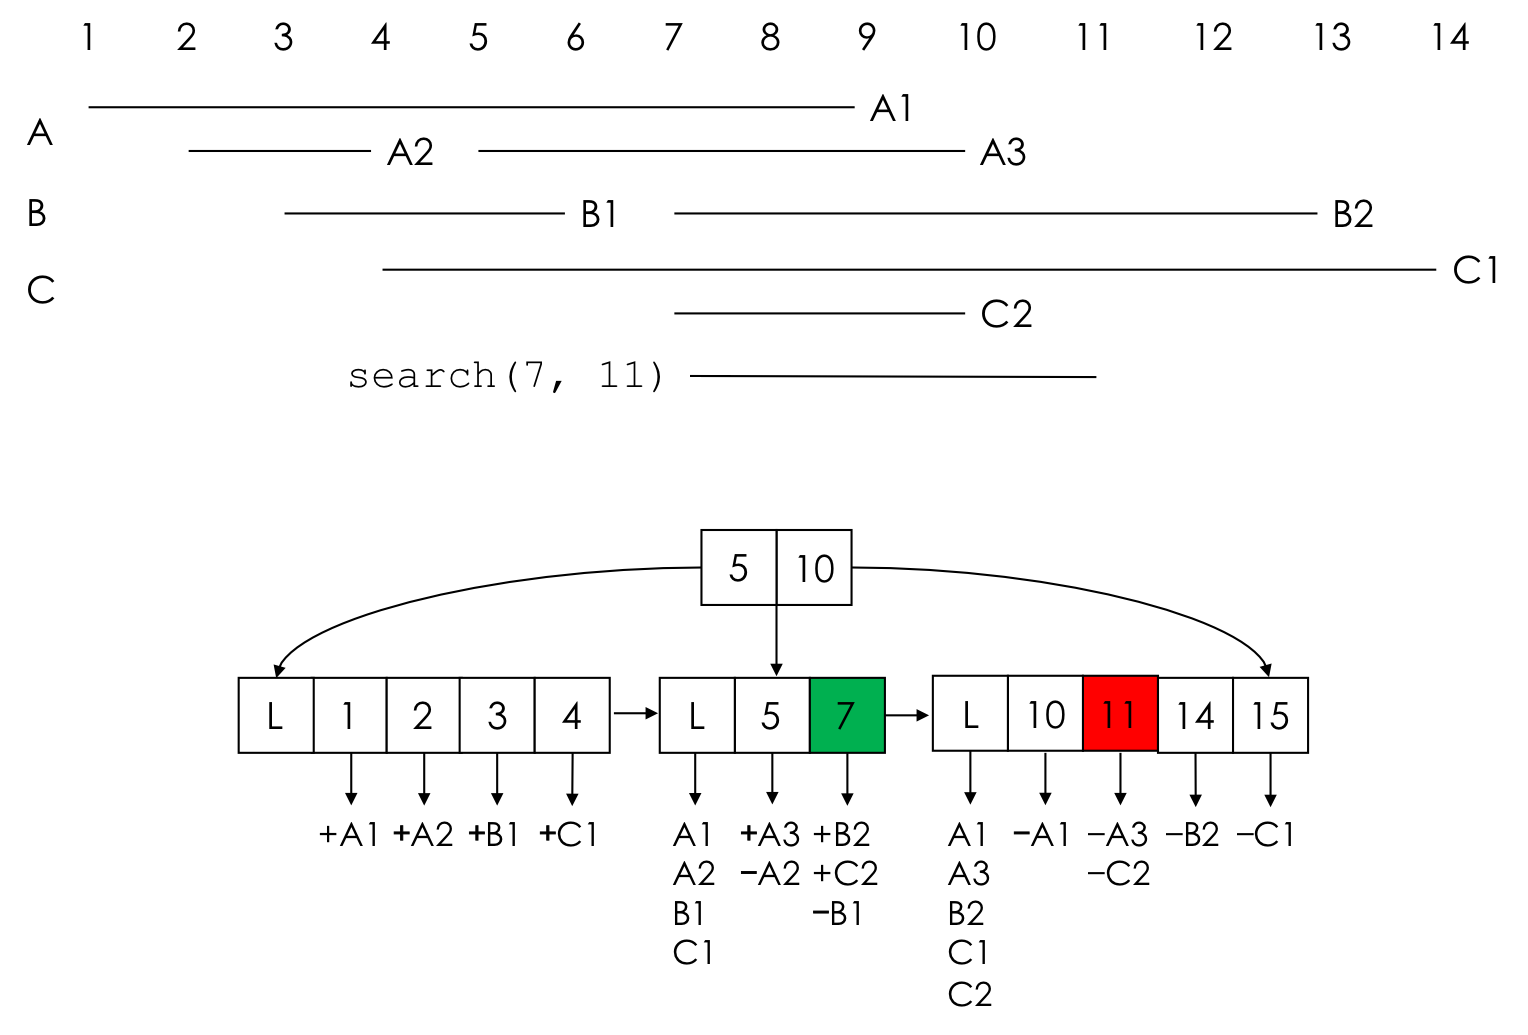
Each interval corresponds to two keys in the tree, one for a start and one for the end. Each key in a leaf node corresponds to a list of interval starts (they have the “+” sign), and interval ends (they have the “-“ sign). To search for overlaps in the region [7,11], we search the tree for 7 (marked in green) and 11 (marked in red), then scan the keys between those two keys collecting new intervals. In reality, it is a bit more complicated, see the paper for full details.